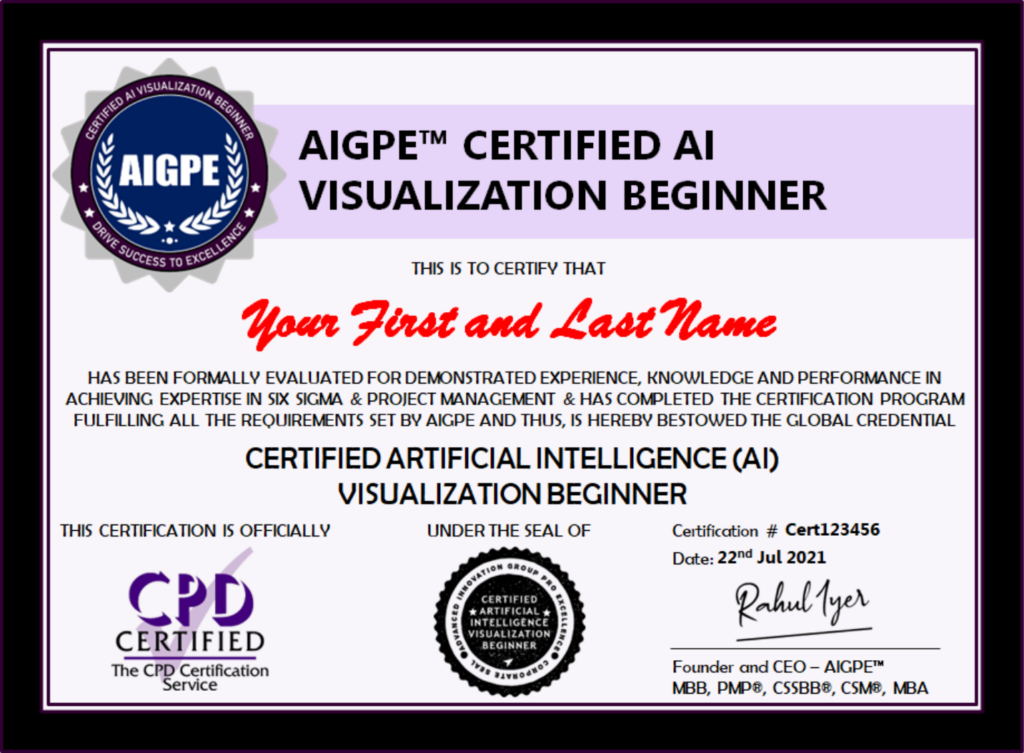
The AIGPE™ ChatGPT for Six Sigma Visualizations: Use AI & Create Charts Body of Knowledge is universal, practically driven, and represents core competencies needed by a Certified AI Visualization Beginner professional.
AIGPE™ Body of Knowledge | Certified AI Visualization Beginner
1.1 What is ChatGPT?
1.2 What is Julius AI?
1.3 Is It Okay to Learn Just One AI Tool?
2.1 What is Six Sigma?
2.2 What is Continuous Data?
2.3 What is Discrete Data?
2.4 Examples of Continuous and Discrete Data
2.5 Basics of Charts and Graphs
3.1 What is a Bar Chart?
3.2 What is the difference between the Vertical, Horizontal, Stacked, and the Grouped Bar Chart?
3.3 Business Case Study - Bar Chart
3.4 Create a Bar Chart using ChatGPT
3.5 Create a Bar Chart using Julius AI
3.6 Business Case Study - Interpretations and Recommendations
3.7 Activity - Bar Chart
4.1 What is a Line Chart?
4.2 Business Case Study - Line Chart
4.3 Create a Line Chart using ChatGPT
4.4 Create a Line Chart using Julius AI
4.5 Business Case Study - Interpretations and Recommendations
4.6 Activity - Line Chart
5.1 What is a Pie Chart?
5.2 Business Case Study - Pie Chart
5.3 Create a Pie Chart using ChatGPT
5.4 Create a Pie Chart using Julius AI
5.5 Business Case Study - Interpretations and Recommendations
5.6 Activity - Pie Chart
6.1 What is a Donut Chart?
6.2 Business Case Study - Donut Chart
6.3 Create a Donut Chart using ChatGPT
6.4 Create a Donut Chart using Julius AI
6.5 Business Case Study - Interpretations and Recommendations
6.6 Activity - Donut Chart
7.1 What is a Histogram?
7.2 Business Case Study - Histogram
7.3 Create a Histogram using ChatGPT
7.4 Create a Histogram using Julius AI
7.5 Business Case Study - Interpretations and Recommendations
7.6 Activity - Histogram
8.1 What is a Scatter Plot?
8.2 Business Case Study - 2D Scatter Plot
8.3 Create a 2D Scatter Plot using ChatGPT
8.4 Create a 2D Scatter Plot using Julius AI
8.5 Business Case Study - Interpretations and Recommendations
8.6 Activity - 2D Scatter Plot
8.7 Business Case Study - 3D Scatter Plot
8.8 Create a 3D Scatter Plot using ChatGPT
8.9 Create a 3D Scatter Plot using Julius AI
8.10 Business Case Study - Interpretations and Recommendations
8.11 Activity - 3D Scatter Plot
- Duration: 3.5 hours
- Lectures: 75+
- Activities: Yes
- Downloadable Resources: 175+
- Full Lifetime Access: Yes
- CPD Accredited: Yes
- PDU Approved: Yes
- Certification Exam: Yes
- Program Certification: Yes


